West Bengal's electoral violence has seen a significant drop from 1,278 injuries in 2016 to fewer than 30 in 2026, as depicted in a striking graphic narrative.
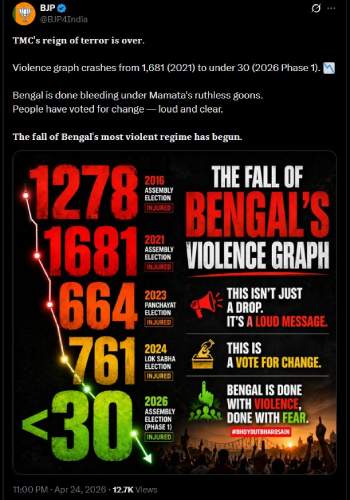
A striking visual narrative capturing a decade of electoral violence in West Bengal presents a sharp and provocative storyline—one that blends data, perception, and political messaging into a single frame. The graphic traces a dramatic downward trajectory in the number of people reported injured during elections over the years, framing it as “The Fall of Bengal’s Violence Graph.”
The timeline begins with the 2016 Assembly elections, where the number of injured is shown as 1,278. This figure, presented in deep red, sets the tone for what the graphic frames as a period of high volatility. Red, universally associated with danger and alarm, reinforces the seriousness of the situation. Electoral violence in West Bengal has historically been a contentious issue, often linked to intense political rivalries, grassroots-level clashes, and high-stakes contests for power. The 2016 figure though taken from unverified accounts, as presented here, becomes a symbolic starting point,an indicator of a system under stress.Moving to the 2021 Assembly elections, the number climbs even higher to 1,681 injured. This escalation is significant within the narrative. Rather than showing improvement, thedata suggests that violence intensified during this period. In political terms, 2021 was indeed a highly charged election year in West Bengal, marked by fierce competition, high voter turnout, and national-level attention. The graphic captures this moment as the peak of the violence curve, a culmination of years of political friction.
 Poster Release by BJP Official X Handle @BJP4India
However, the story takes a decisive turn after 2021. The 2023 Panchayat elections show a sharp drop in injuries to 664. Visually, the color shifts from red to orange, signaling a move away from crisis toward moderation. This transition is crucial to the narrative being constructed. Panchayat elections in West Bengal are often localized and can be intense, but the graphic suggests that something changed between 2021 and 2023—whether in terms of administration, law enforcement, political strategy, or public behavior.The 2024 Lok Sabha elections present a slightly mixed picture, with the number rising to 761 injured. While this is an increase compared to 2023, it remains significantly lower than the peaks of 2016 and 2021. In the context of the graphic, this uptick does not disrupt the overall downward trend. Instead, it appears as a minor fluctuation within a broader narrative of decline. The color palette continues to lighten, maintaining the sense of gradual improvement.
Then comes the most dramatic element of the unofficial graphic: the 2026 Assembly Election (Phase 1), where the number of injured is shown as fewer than 30. The color turns green, symbolizing safety, stability, and success. The drop is not just incremental—it is near-total. From over a thousand injuries to less than thirty, the change is portrayed as transformative, almost revolutionary. The downward arrow at the end of the graph reinforces this message visually, suggesting a definitive break from the past.
But the graphic does not stop at presenting numbers. It layers these unverified figures with strong, declarative messaging. “This isn’t just a drop. It’s a loud message.” This line shifts the narrative from data to interpretation. It implies that the reduction in violence is not accidental but meaningful—perhaps the result of deliberate action or a shift in public will. The phrase invites viewers to see the numbers as evidence of a larger change.“This is a vote for change” goes even further, directly linking the decline in violence to democratic choice. It suggests that voters themselves have driven this transformation, possibly by supporting a different political direction or rejecting the culture of violence. This approach puts the public in control, transforming the graph into a narrative of shared decision-making.
The final declaration, “Bengal is done with violence, done with fear”, is both aspirational and assertive. It presents the current moment not just as an improvement but as a conclusion to a long-standing problem. The accompanying imagery of a crowd with raised hands against a glowing skyline reinforces this sense of public empowerment and hope. It evokes the idea of a Society that has moved beyond Fear and Conflict, embracing a more peaceful democratic process.
Yet, while the graphic is compelling, it also invites critical examination. Electoral violence is a complex issue, influenced by multiple factors including political competition, administrative capacity, law enforcement effectiveness, and Social Dynamics. While the figures shared (graphic) in the BJP’s post on X lack cited sources, clear definitions, or methodological details, the Chief Election Commission has also not reported any repolling or major incidents of violence so far.For instance, what constitutes “injured”? Are these official police records, media reports, or estimates? Do they include minor injuries, serious assaults, or all reported incidents? Without such context, the numbers remain open to interpretation.The dramatic drop to fewer than 30 injuries in 2026 (Phase 1) is particularly striking. While it may indicate a genuine improvement, it could also reflect partial data, limited reporting, or the fact that it represents only the first phase of the election. Elections in West Bengal is conducted in Two phases, and early data may not capture the full picture.
At the same time, it highlights an important reality: the issue of electoral violence remains central to discussions about democracy in West Bengal. Whether one agrees with the narrative or questions its framing, the very existence of such a graphic underscore the importance of the topic. It reflects a public discourse where safety, fairness, and the integrity of elections are key concerns.In the end, the story told by this visual is one of contrast—between past and present, conflict and calm, fear and hope. It presents a vision of a state that has undergone a significant transformation, moving toward a more peaceful electoral environment. Whether this vision fully aligns with ground realities is a matter for further analysis, debate, and verification.What cannot be denied, however, is the power of the narrative itself. By combining data with design and messaging, the graphic transforms numbers into a story—one that seeks to persuade, inspire, and perhaps even redefine how people view the democratic journey of West Bengal.